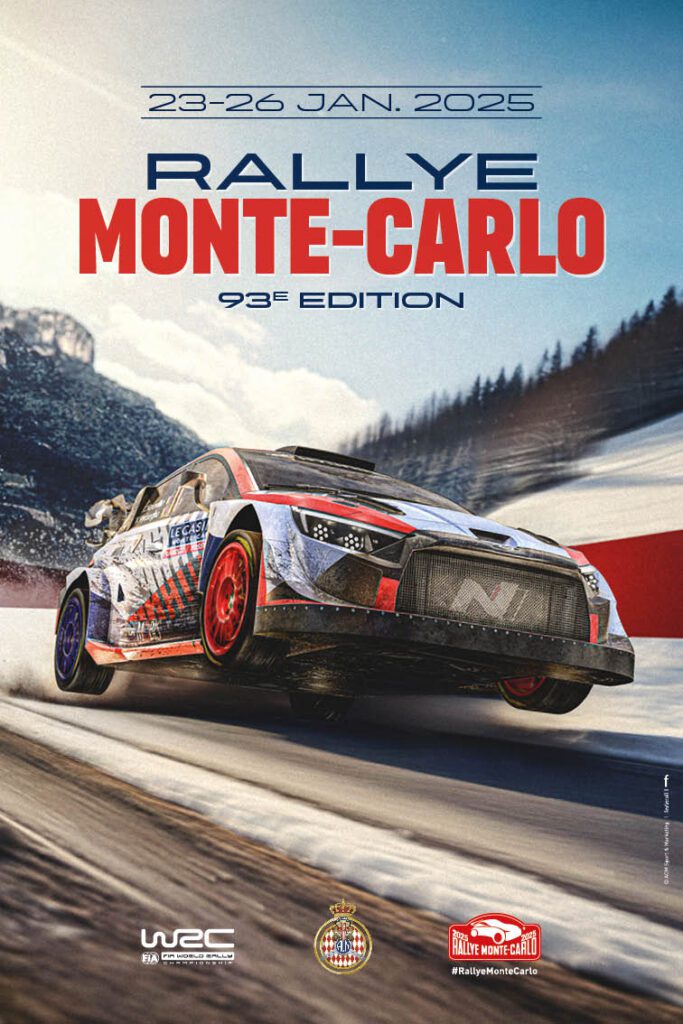
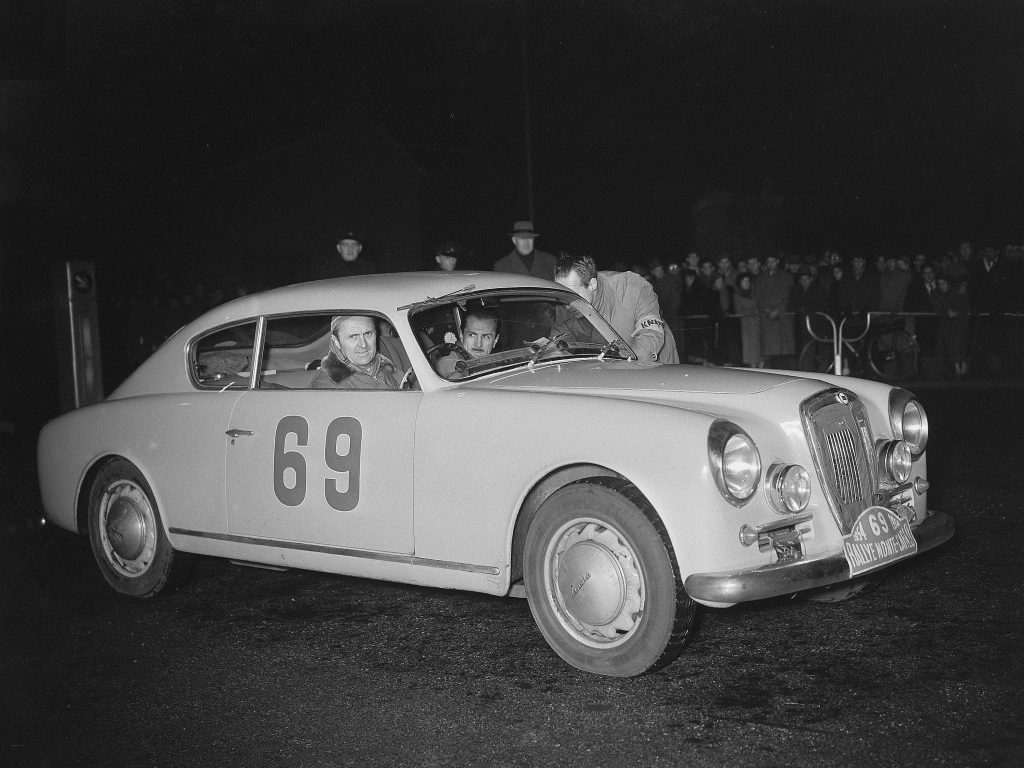
Alright, so today I’m gonna share my experience tackling a personal project inspired by the legendary “Rallye Automobile Monte Carlo.” I wouldn’t call it a smashing success, but definitely a learning experience worth documenting.

It all started with me wanting to play around with some GPS data visualization. I’ve always been fascinated by rally racing, especially the Monte Carlo one with its crazy weather and winding mountain roads. So, I thought, “Why not try to recreate a simplified version of a stage using real GPS data?”
First thing I did was hunt down some publicly available GPS data from a past Monte Carlo rally. This wasn’t as easy as I thought. Most sites wanted you to pay for it. I ended up finding a smaller dataset buried in some forum – it wasn’t perfect, but it was enough to get started. I snagged it, cleaned it up a bit in Excel (manually removing the obvious errors and outliers), and saved it as a CSV file.
Then came the fun part: the coding. I decided to use Python with the `matplotlib` and `geopandas` libraries. I started by importing the CSV data into a pandas DataFrame. Pretty standard stuff.
Next, I used `geopandas` to create a GeoDataFrame from the GPS coordinates. This allowed me to easily plot the rally route on a map. Finding a decent basemap was a bit of a pain. I messed around with different tile providers until I found one that looked reasonable and didn’t require an API key or something. I settled on using `contextily` for this part.
Plotting the raw GPS data initially looked like a tangled mess. The points were too dense, and it was hard to follow the route. So, I implemented a simple smoothing algorithm. I used a moving average filter to smooth out the GPS coordinates, which made the route much easier to visualize. It’s nothing fancy, just a basic rolling average, but it made a big difference.

After getting the route plotted, I wanted to add some visual flair. I decided to color-code the route based on speed. I calculated the speed between consecutive GPS points (using the timestamp and distance between points) and then used a color gradient to represent the speed at each point. This made it easy to see where the rally car was speeding up or slowing down.
Of course, things didn’t go smoothly the whole time. I ran into a bunch of errors along the way. The most annoying one was related to the coordinate reference system (CRS). The GPS data was in one CRS, and the basemap was in another, which caused the route to be plotted in the wrong location. It took me a while to figure out that I needed to reproject the GPS data to match the CRS of the basemap. I spent a good hour banging my head against the wall on that one.
Another issue I faced was the sheer amount of data. The original dataset was quite large, and plotting all the points took a long time. I ended up downsampling the data by only plotting every nth point, which significantly improved performance without sacrificing too much detail.
In the end, I got a decent visualization of the rally stage. It’s not perfect, but it’s a good starting point. I learned a lot about working with GPS data, geospatial libraries, and data visualization techniques. Here’s a quick list of what I actually did:
- Downloaded GPS data (finally found some free data).
- Cleaned up the data using excel(removed errors manually).
- Used `pandas` to read and process the CSV data.
- Utilized `geopandas` to create a GeoDataFrame.
- Plotted the route on a map using `matplotlib` and `contextily`.
- Smoothed the route using a moving average filter.
- Color-coded the route based on speed.
What’s next? Well, I’d like to try adding more features, such as elevation data and interactive elements. I also want to explore different visualization techniques and maybe even create a 3D model of the rally stage. But for now, I’m happy with what I’ve accomplished. It was a fun little project that challenged me and helped me learn new skills.

So, yeah, that’s my “Rallye Automobile Monte Carlo” inspired project. Nothing groundbreaking, but a solid learning experience. Maybe it’ll inspire someone else to give it a shot too. Cheers!

